
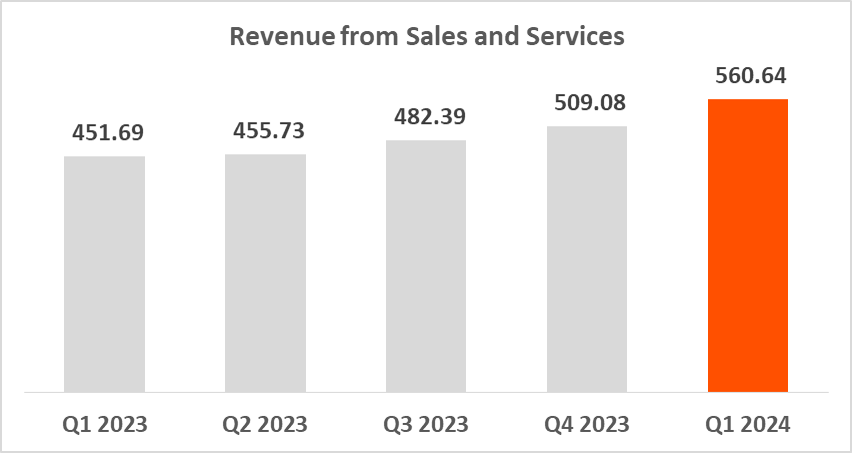
Revenue from Sales and Services (Million Baht)
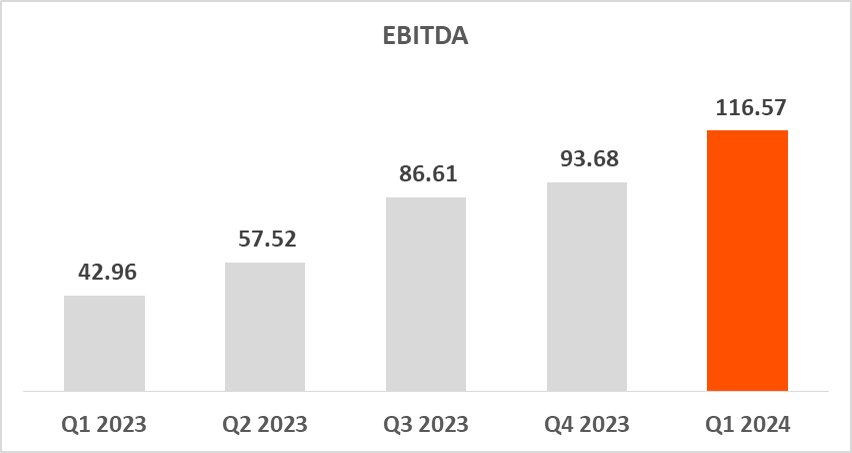
EBITDA (Million Baht)
Current ratio

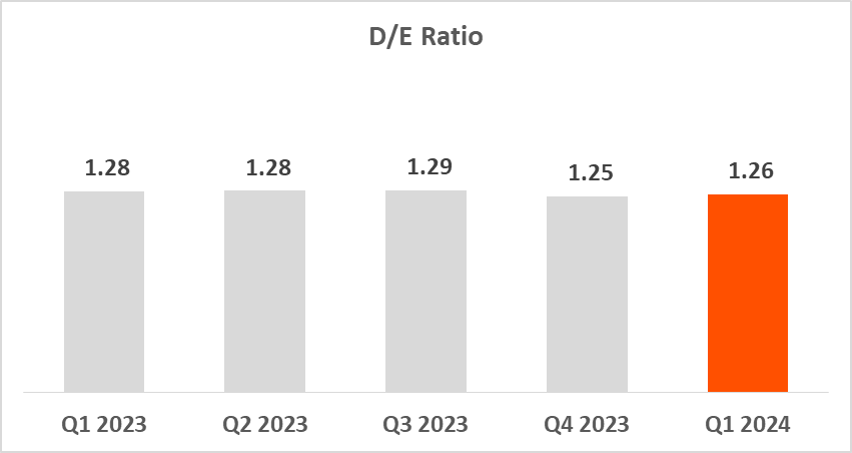
Debt to equity (x)
Financial Information
| UNIT: MILLION BAHT | FY 2022 | Q1 : 2023 | Q2 : 2023 | Q3 : 2023 | Q4 : 2023 | FY 2023 | Q1 : 2024 |
|---|---|---|---|---|---|---|---|
| Revenue from Sales and Services | 1,619.05 | 451.69 | 455.73 | 482.39 | 509.08 | 1,898.89 | 560.54 |
| Total cost | 1,262.86 | 349.23 | 331.76 | 336.40 | 364.97 | 1,382.36 | 384.94 |
| EBITDA | 136.35 | 42.96 | 57.52 | 86.61 | 93.68 | 280.77 | 116.57 |
|
Profit for the period Profit attribute to owners of the parent |
40.32 40.56 |
10.20 7.66 |
22.40 11.66 |
45.36 27.75 |
46.22 33.08 |
124.18 80.15 |
67.67 42.89 |
| Total asset | 2,780.60 | 2,844.16 | 2,896.60 | 2,987.24 | 3,044.86 | 3,044.86 | 3,135.89 |
| Total liabilities | 1,547.11 | 1,597.36 | 1,612.60 | 1,683.61 | 1,693.34 | 1,693.34 | 1,755.93 |
| Total equity | 1,235.49 | 1,246.80 | 1,257.00 | 1,303.64 | 1,351.52 | 1,351.52 | 1,397.96 |
| Operating cash flow (YTD) | 128.50 | 54.62 | 77.93 | 118.80 | 172.89 | 172.89 | 68.29 |
| Financial ratios Gross profit margin (%) |
22.00% | 22.68% | 27.20% | 30.26% | 28.30% | 27.20% | 31.34% |
| EPS | 0.08 | 0.01 | 0.02 | 0.05 | 0.05 | 0.13 | 0.07 |
| Current ratio | 1.61 | 1.43 | 1.34 | 1.26 | 1.25 | 1.25 | 1.26 |
| Debt to equity (x) | 1.25 | 1.28 | 1.28 | 1.29 | 1.25 | 1.25 | 1.26 |